
Understand what changed. Then ask why.
Bring business figures, metric definitions, and supporting documents into a review that makes the calculations inspectable.
Illustrative analysis. All regional figures and definitions below are fictional.
Define the question and the metric.
Compare quarterly revenue by region. Show the arithmetic, use our revenue definition, and separate observed changes from explanations.
A useful analysis starts with the reporting period, business definition, units, and authorized data. Bowra’s current governed structured-data integration is Datarc; other data access depends on the tools configured in your environment.
A change you can recalculate.
| Region | Q1 | Q2 | Change |
|---|---|---|---|
| Americas | $1.00M | $1.15M | +15% |
| Europe | $0.60M | $0.57M | −5% |
| Asia Pacific | $0.40M | $0.46M | +15% |
| Total | $2.00M | $2.18M | +9% |
Total change = ($2.18M − $2.00M) ÷ $2.00M = 9%
The Americas contributed $150,000 of the $180,000 net increase. Europe declined by $30,000. These describe where the change occurred; they do not explain its cause.
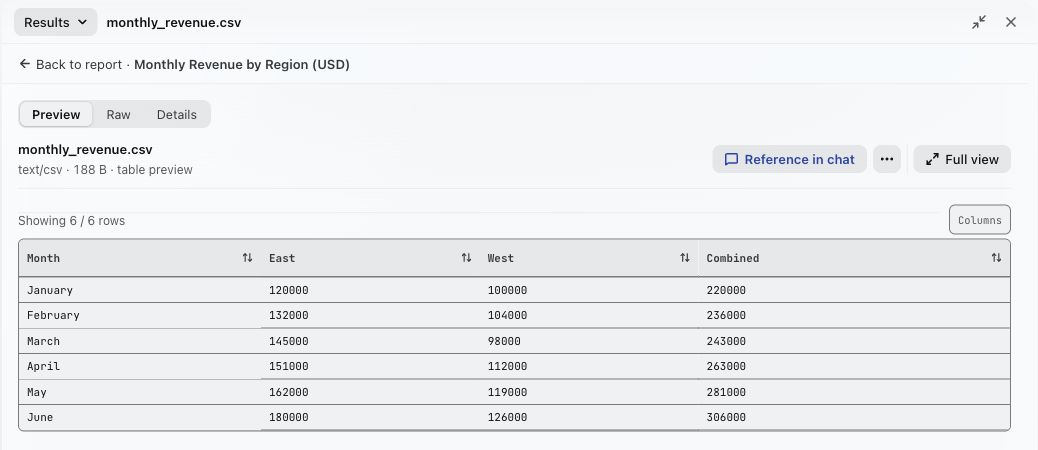 View larger
The definition is part of the answer.
Revenue means recognized revenue for the period, assigned to the customer billing region. It excludes bookings.
This fictional metric definition changes how the result should be read. Booking growth, customer churn, currency movements, or timing could require different data and a separate investigation.
Bowra provides numeric provenance and controlled calculation capabilities. The available calculation and report workflows depend on deployment configuration.
Deliver an explanation people can challenge.
- State the metric, period, and source.
- Show the comparison and arithmetic behind important figures.
- Separate observations from hypotheses.
- Keep unanswered questions visible for the next investigation.
Start with a grounded comparison. Add causal conclusions only when the supporting evidence is available.